 The impact of the flu on a population can be measured by looking at figures including cases, hospitalisations and deaths.From shutterstock.com
From early this year it’s been apparent the 2019 Australian influenza “season” was going to be different. Normally, the flu season coincides with the winter months of July and August, sometimes stretching to September and October.
But this year, things have happened much earlier, with a record number of influenza cases reported in summer and autumn.
So what’s been happening, and is it really as bad as the media have been reporting? Here we look at some of the latest data on cases and their outcomes to see if it is indeed “a horror flu season”.
The impact of influenza on the community is measured in several ways. The most basic measure is to simply count the number of cases of people presenting to their GP with influenza-like illness.
Sometimes the doctor will take a swab, and these are tested in the laboratory to confirm that influenza virus is present (it’s possible another respiratory virus or bacteria might be causing the flu-like symptoms).
Read more: The 2019 flu shot isn't perfect – but it's still our best defence against influenza
Cases of influenza-like illness were increasing in early March, peaked in early June, and are now decreasing. Laboratory confirmed cases (the results of which we see in the above chart) show a similar trend. We haven’t included July in this chart because it’s not finished yet, but we’re still seeing a high number of cases into July.
Compared to previous years, 2019 looks like a big year with more than 120,000 cases of lab confirmed influenza up to the end of June. But it’s not nearly as bad as 2017, which had more than 250,000 cases reported to the National Notifiable Diseases Surveillance System (NNDSS) by the end of the year. As this season occurred much later than 2019’s, 2017 had only 24,000 cases reported up to July 7.
The good news is that as the 2019 season started earlier, it’s also likely to finish earlier than usual. This is because once the main influenza season starts, it usually ends around 12-16 weeks later, when the number of susceptible people drops below the level required to maintain efficient circulation.
 FluCAN (via Department of Health Influenza Surveillance Report), CC BY-ND
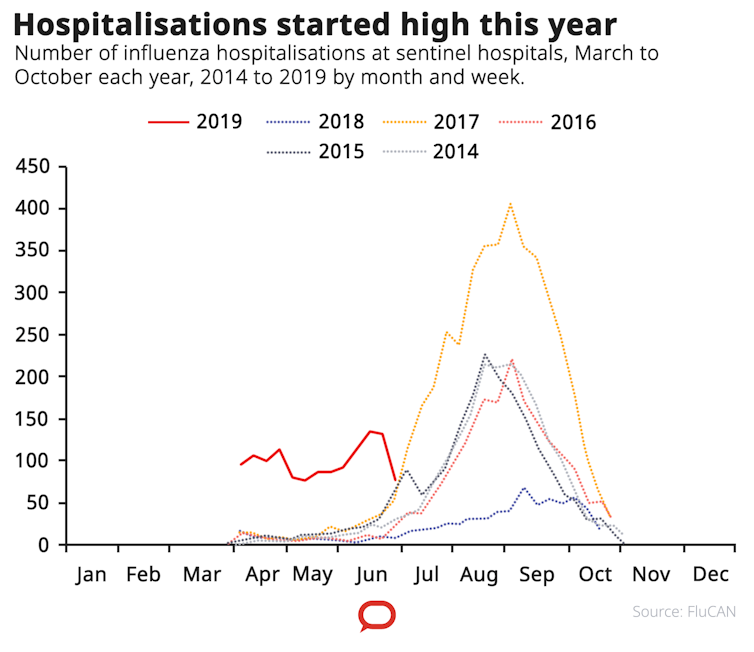
Another measure of how severe the influenza season is can be gauged by the number of hospitalisations, including admissions to ICU (intensive care units).
Hospital admissions show from April 1 to June 30 this year, there have been 1,309 admissions to the Australian sentinel surveillance hospitals (a number of hospitals where flu admissions are tracked each year).
This figure is much higher than previous years at the same time point. In 2018, there were 90 admissions, and in 2017, 311. But in 2017 the season arrived much later and more seriously and ultimately resulted in 3,969 admissions for that year.
Read more: Kids are more vulnerable to the flu – here's what to look out for this winter
It’s also useful to look at the proportion of people attending hospital with influenza infections who are admitted directly to ICU. In 2019 it’s been 6.7% of admissions compared to 2018 (a mild influenza year) with 8.1% of admissions, and 2017 (a very severe year) with 8.9% of admissions.
The 2019 ICU rate is at the lower end of historical figures which range from 8.7% in 2015 to 14.2% in 2013. By this measure, the 2019 season is of a similar severity to that seen in previous seasons and is therefore not exceptional.
While hospital admissions can be measured relatively easily, measuring deaths due to influenza is more complicated for a few reasons. The flu often paves the way for secondary bacterial infections, like pneumonia, which can lead to hospitalisation and death, particularly in the elderly. When this happens, it can be difficult to link death directly to an earlier influenza infection.
And, death data is often very delayed. So readily available death data collected by the NNDSS is considered a significant underestimate of the actual number.
To the end of June 2019, there were 231 influenza-related deaths reported to the NNDSS. Virtually all of these were due to the influenza A strain. They spanned all ages, but most deaths were in the elderly (80 years and older).
Read more: Sick with the flu? Here's why you feel so bad
This compares to 24 and 21 deaths over the same period in 2018 and 2017 respectively. But these figures grew to 55 deaths and 598 deaths reported by the end of 2018 and 2017 respectively.
Clearly 2019 is more severe than 2018, based on the measures detailed above, but at this stage it looks like it will be less severe than 2017. However, we’ll need to wait for a number of weeks yet to be sure.
When we look at what’s happened in each state of Australia so far this year, we see some interesting differences in how the season has played out. Most states began to see significant rises in cases in April, while South Australia had already peaked in April and this number of cases was maintained into May. This means that most other states still have a number of weeks of influenza circulation to endure.
People of all ages are susceptible to influenza, and this is reflected in the wide range of ages at which people are infected. Young children (especially those under 10 years of age) and the elderly (especially those over 80 years of age) are more susceptible, and are often more severely affected by influenza infections – as are pregnant women.
Interestingly, different types of influenza affect different age groups, with influenza B and influenza A(H1N1) more common in the young and influenza A(H3N2) more common in the elderly.
Read more: Here's why the 2017 flu season was so bad
At this stage we can conclude that the 2019 influenza season is quite different to our usual seasons and overall, is likely to be one of the more severe seasons seen in the last 20 years.
So while 2019 doesn’t appear to be the worst season we’ve ever seen – that’s likely to remain with 2017 – it may well run a close second place. But we’ll have to wait another month or two before we can be sure.
Ian Barr and the Melbourne WHO Collaborating Centre for Reference and Research on Influenza is supported by the Australian Government Department of Health.
Authors: Ian Barr, Deputy Director, WHO Collaborating Centre for Reference and Research on Influenza
| < Prev | Next > |
|---|